Resources
Article
Orthodontic practices rely heavily on practice management software to manage operations, but many tools fall short when it comes to actionable insights.
Without the right orthodontic analytics, you’re making clinical and business calls in the dark. Real growth comes from seeing the patterns behind your numbers and having the data to change them.
This article highlights five overlooked metrics that can transform your orthodontic analytics and improve practice performance.
Top-line numbers show performance, but they rarely explain why results look the way they do. Without deeper orthodontic analytics, you miss the breakdowns that slow starts, waste chair time, or chip away at revenue.
Advanced metrics bring blind spots into view. For example, a no-show rate might seem fine until you compare it to peer benchmarks and see you’re losing thousands in unfilled chair time. Or you might track initial calls to scheduled consults and discover that half your prospects drop off before they ever walk in.
With that level of insight, you can spot problems early and fix them before they cost you revenue, time, or patient trust.
Most orthodontic patient management software delivers the basics, but it rarely explains the story behind the numbers. These five metrics reveal what’s really happening in your practice and where to take action.
Why it matters. This metric tells you what percentage of patients who come in for a consult actually begin treatment.
When a patient says “I’ll think about it” and never calls back, your software should track how often that occurs.
If the rate is low, something in the handoff from consult to start is losing patients—whether it’s orthodontic treatment presentation, follow-up timing, or patient financing.
How to use it. Track this rate over time and compare it to your own benchmarks. If it dips, review your treatment coordinator scripts, follow-up process, and scheduling availability. Even a small lift in conversion can add dozens of starts and thousands in revenue each year.
Why it matters. The treatment plan acceptance rate measures how many patients say yes to the plan you present. If the number is low, the issue is usually cost, clarity, or how much trust the patient has in your recommendation.
How to use it. Track this against your own history and industry benchmarks. If you’re underperforming, sharpen how you explain options, tackle common concerns during the consult, and make sure financing is simple. Raising this rate, even slightly, can create a steady stream of new starts and stronger revenue.
Why it matters. Average days to start treatment is the clock on how fast patients move from consult to chairs. When that clock runs too long, you risk no-shows, second opinions, and lost starts.
How to use it. Measure it against your target and what other practices your size are hitting. If it’s dragging, offer start dates on the spot, follow up the next day, and cut red tape that slows patients down. The sooner they start, the better your chances of keeping them.
Why it matters. This metric shows how often patients miss each kind of appointment. It tells you if consults disappear more than follow-ups, or if debonds keep getting bumped. That detail makes it easier to see where your schedule is bleeding time.
How to use it. Focus on the categories with the highest no-shows and address them directly.
When consults vanish, tighten reminders and confirmations. For follow-ups, look at timing and offer more flexible slots. Fixing the biggest gaps first keeps your schedule tight and production steady.
Why it matters. Revenue per chair hour tells you exactly how much each operatory earns in the time it’s in use. When a chair underperforms, it cuts into your daily production, whether the cause is open gaps, long appointments that could be shorter, or inefficient staffing.
How to use it. Watch for chairs that consistently bring in less and pin down the reason. Book it for higher-value visits like starts or debonds, avoid stacking it with back-to-back low-production checks, and assign an experienced assistant who can keep the flow moving. Small adjustments here can turn an underperforming chair into one of your most profitable.
Missing metrics leave gaps in your orthodontic analytics and make it harder to run your practice at full capacity. Without the full picture, you react later, work on the wrong problems, and lose patients you could have started.
Here are some of the most common consequences:
Complete analytics let you act sooner and focus on the changes that protect starts, keep chairs productive, and strengthen your practice.
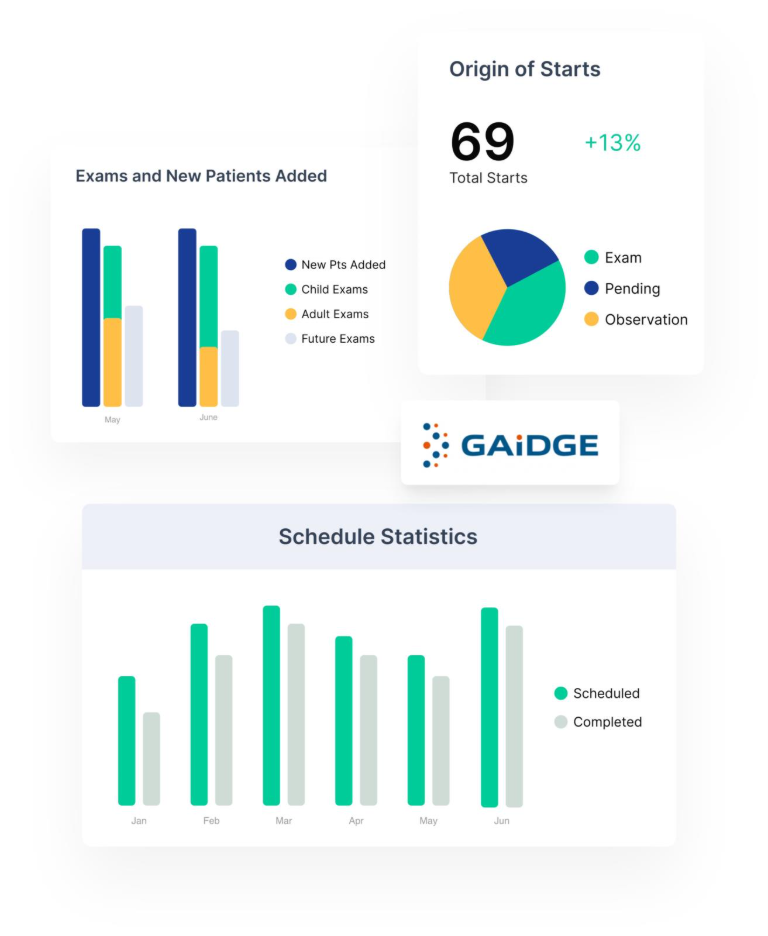
When you know exactly what’s happening in your practice, you can fix problems before they cost you patients or production. Tops’ Practice Analytics, powered by Gaidge Analytics, turns raw numbers into clear, actionable insights so you can see what’s working and where to focus next.
Your practice’s priorities aren’t the same as the one down the street, and your reports shouldn’t be either.
Tops lets you build dashboards around the metrics that matter most to you, from consult-to-start rates to revenue per chair hour. See your data in a format that’s easy to read, simple to share, and ready to act on, so every team member knows where the practice stands and what to work on next.
When you run more than one location, guessing which numbers are up to date can slow every decision.
Tops keeps metrics synced across all offices in real time, so you’re working from the same source of truth no matter where you are. You can see performance for the entire practice or drill down into a single location without juggling spreadsheets or waiting on end-of-month reports.
The right metrics don’t just sit in a report. They flag the moment your schedule starts to bottleneck so you can fix it before patients and revenue are lost. Over time, tracking these numbers builds a smoother flow, steadier production, and decisions you can stand behind.
Tops’ Practice Analytics, powered by Gaidge Analytics, puts all of that insight in one place so you can fix issues fast and keep your practice performing at its best.
Ready to see your practice in a whole new light? Schedule a demo with Tops today.
What are the most important KPIs in orthodontic practice management software?
Key KPIs include consultation-to-start conversion, treatment plan acceptance, average days to start treatment, no-show rates by appointment type, and revenue per chair hour.
How does orthodontic analytics improve patient starts?
By tracking detailed metrics, practices can identify bottlenecks in scheduling, improve treatment presentation, and reduce delays, all of which help boost new patient starts.
Why should practices choose Tops for orthodontic analytics?
Tops, powered by Gaidge Analytics, provides customizable dashboards, real-time multi-location syncing, and integrations with financial and scheduling tools, giving practices actionable insights that drive measurable growth.
The technology inside your orthodontics practice should work hard for you. Tops’ complete ecosystem gives you the power, speed, and agility to move on to what’s next.
Sign up for our newsletter and get the latest news about Tops product updates, seasonal and new doctor promos, and free tools and tips to improve your practice’s performance.